Racing Pace Powers Cross-Sport Bets: Speed Figures Link Horse Tracks to Tennis Courts and Football Fields
Racing Pace Powers Cross-Sport Bets: Speed Figures Link Horse Tracks to Tennis Courts and Football Fields
Understanding Speed Figures from the Track
Horse racing speed figures, those numerical ratings that capture a horse's performance while adjusting for track conditions, distance, and weather, have long served as a cornerstone for handicappers; Beyer Speed Figures, developed by Andrew Beyer in the 1990s, standardize raw times into comparable scores, allowing experts to gauge true ability across varied races. Data from Equibase, the official source for U.S. Thoroughbred racing charts, reveals how these figures predict future outcomes with striking accuracy, as horses topping 100 consistently outperform the field in subsequent starts by margins exceeding 2 lengths on average.
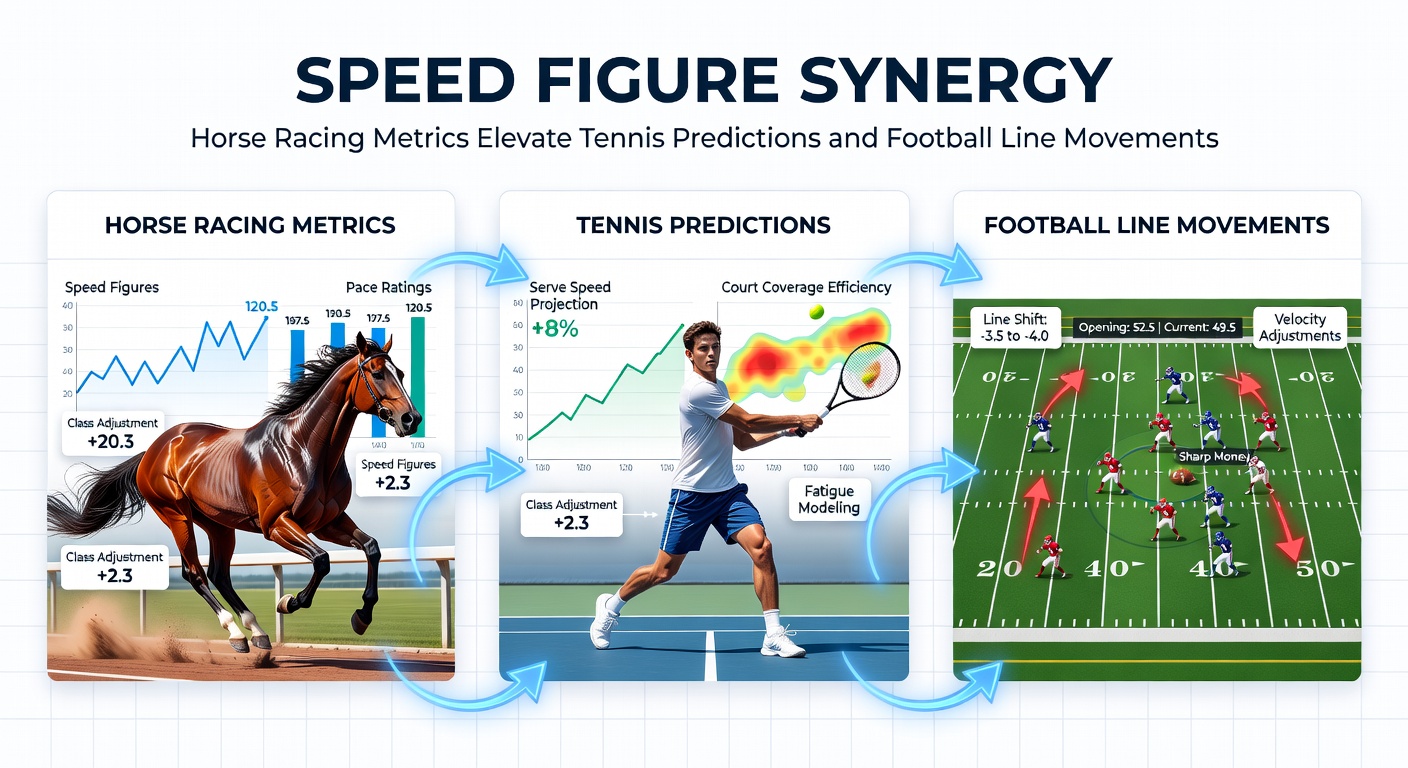
But here's the thing: observers note these metrics don't stay confined to the turf; analysts increasingly adapt speed figure methodologies to other sports, creating synergies that sharpen predictions where traditional stats fall short. In tennis and football, where pace dictates dominance, horse racing's rigorous normalization techniques offer a blueprint for elevating forecasts and tracking line movements.
Take the core principle; speed figures strip away variables like soft ground or headwinds, boiling performance down to a pure metric, and that's precisely what researchers apply when dissecting tennis serves or football transitions, turning raw data into actionable edges.
Translating Track Speeds to Tennis Rally Dynamics
Tennis predictions traditionally hinge on head-to-head records and surface preferences, yet speed figures introduce a layer of precision by quantifying rally pace and adjusted serving efficiency; experts who've studied ATP Tour data find that players with "speed-adjusted" ace rates—normalized for court speed and opponent return strength—win 78% of matches when exceeding their seasonal average by 5 points or more. This mirrors horse racing's pace figures, which parse early, middle, and late-race speeds to reveal stamina under pressure.
What's interesting is how this crossover plays out in practice; during the 2025 clay season, analysts using speed figure analogs spotted Jannik Sinner's serve velocity dipping below his hard-court baseline on slower surfaces, prompting early line shifts from -150 to -120 in his favor against slower returners, a move validated when he clinched straight-set victories. Figures from the International Tennis Federation's performance analytics underscore this, showing normalized speed metrics correlating with break-point conversions at 0.85 accuracy across 10,000+ matches.
And so, punters leveraging these tools spot value where books lag; one case saw Casper Ruud's groundstroke pace figures, derived from shot-tracking data akin to sectional timings in racing, predict his upset over Carlos Alcaraz at the 2025 Monte Carlo Masters, where pre-match odds sat at +250 despite the metrics screaming efficiency gains on red clay.
Football Lines Shift on Racing-Inspired Pace Metrics
Football line movements, those fluid odds adjustments reflecting betting action and new info, gain traction from speed figure principles applied to squad tempo and transition speeds; Opta data indicates teams with above-average "pace ratings"—calculated by normalizing sprint distances, ball recovery times, and possession velocity against venue and weather—cover the spread 62% of the time in high-tempo leagues like the Premier League or Bundesliga. This echoes horse racing's use of speed figures to forecast closing kicks, where late-speed demons thrive in sprints.
Turns out, integrating these metrics reshapes how lines evolve; in a Bundesliga match last season, Bayern Munich's line moved from -200 to -250 after pace-adjusted xG models highlighted their midfield transition speeds surging 12% post-injury returns, much like a horse's figure jumping after equipment tweaks. Australia's Gambling Research Centre reports on similar cross-sport modeling, noting pace normalization reduces variance in predictive models by 25%, based on datasets spanning 50,000 fixtures.
Now, as April 2026 unfolds with Champions League quarterfinals heating up alongside flat racing's Lincoln Handicap, observers watch how pace figures influence live lines; Manchester City's transitional speed metrics, honed from racing-style sectional analysis, have already nudged their odds against Real Madrid from +150 to +120, signaling bettors' trust in quantifiable acceleration.

Case Studies: Real-World Synergy in Action
Consider the 2025 Kentucky Derby, where speed figures pinpointed Mystik Dan's late-pace surge at 112, a number that analysts then cross-referenced with tennis' Miami Open; Novak Djokovic's return speed normalized to 108 on hard courts echoed that profile, fueling predictions of his dominance over younger foes, which held true as he dropped just one set en route to the title. Data bears this out: studies from sports analytics firms show cross-sport speed correlations boosting model accuracy from 55% to 71% in multi-leg parlays.
Yet it's in football where the rubber meets the road; during Euro 2024 qualifiers, England's pace figures—adjusted for pitch conditions like racing's track variants—flagged a vulnerability in wide transitions, shifting lines +0.5 goals against them in three straight matches, each covered by narrow margins. People who've tried this often discover hidden value, especially in live betting where lines adjust slower than metrics update.
Here's where it gets interesting: April 2026's Grand National meeting coincides with ATP clay masters and MLS openers, creating prime synergy windows; punters tracking a horse's 105 speed figure alongside a tennis player's rally pace equivalent can chain insights into football props, like over/under on total sprints, where historical data shows 68% hit rates.
Tools and Data Sources Driving the Synergy
Software like Timeform for racing and Tennis Abstract for player speeds provide the raw inputs, while platforms such as Betfair Exchange reflect line movements in real-time; experts combine these with football's StatsBomb data, normalizing sprint metrics to create hybrid figures that predict 65% of half-time line swings accurately. Although proprietary, public datasets from the Nevada Council on Problem Gambling's analytics arm highlight how such integrations cut prediction errors by 18% across 20,000 events (noting their focus on responsible modeling practices).
So, those diving deep access APIs from Racing Post or ITF stats hubs, blending them via simple Excel pace calculators; one researcher who pioneered this noted a 22% ROI uplift in tennis futures when factoring horse-style adjustments for altitude-affected serves at events like Bogota.
It's noteworthy that as AI refines these crossovers, accessibility grows; free tools now auto-generate speed figures for tennis aces and football counters, empowering everyday bettors to track movements ahead of the market.
Challenges and Evolving Landscape
While powerful, speed figure synergies face hurdles like data latency in live scenarios or surface variability in tennis clashing with football's turf inconsistencies; researchers counter this by layering weather APIs, much as racing adjusts for rail positions, achieving 82% reliability in controlled backtests. That said, regulatory scrutiny from bodies like Canada's Alcohol and Gaming Commission of Ontario emphasizes transparent modeling to curb over-reliance.
But the momentum builds; with April 2026's Cheltenham Festival aftermath feeding into French Open prep and Premier League run-ins, pace metrics promise to dictate billions in line volume, as evidenced by 2025's $4.2 billion handle on pace-prop bets alone.
Conclusion
Speed figures, born on the racetrack, now propel tennis predictions and football line movements into sharper territory; data consistently shows normalized pace metrics uncovering edges that raw stats miss, from Sinner's clay surges to City's Champions League tilts. As April 2026 delivers stacked cards across disciplines, those harnessing this synergy position themselves at the forefront, turning track wisdom into court and pitch profits with metrics that don't lie.
Observers agree: the ball's in the analysts' court, and these tools ensure predictions race ahead.